karyogram
Takes as input a breakpoints file (e.g. as output by simgenotype) and a sample name, and plots a karyogram depicting local ancestry tracks.
Basic Usage
haptools karyogram \
--bp BREAKPOINTS \
--sample SAMPLE \
--out PNG
See details of the breakpoints file here. If you specify --sample $SAMPLE, the breakpoints file must have breakpoints for $SAMPLE_1 and $SAMPLE_2 (the two haplotypes of $SAMPLE).
Additional Options
You may also specify the following options:
--centromeres <FILE>- Path to a file describing the locations of chromosome ends and centromeres. An example file is given here:tests/data/centromeres_hg19.txt. The columns are: chromosome, chrom_start, centromere, chrom_end. For acrocentric chromosomes, the centromere field is ommitted. This file format was taken from here.--colors "pop1:color1,pop2:color2..."- You can optionally specify which colors should be used for each population. These colors entered can be the matplotlib colors or inputted as hexcode. If colors are not given, the script chooses reasonable defaults.--title <TITLE>- Title for the resulting karyogram.--verbosity <LEVEL>- What level of output the logger should print to stdout. Please see logging levels for output levels. Default = INFO [Optional]
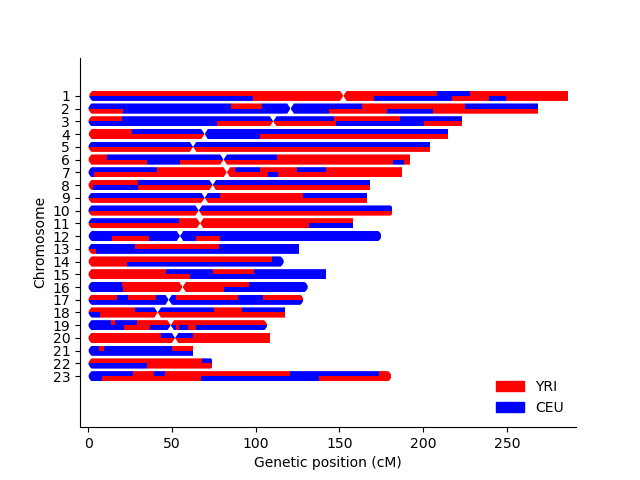
Example
haptools karyogram \
--bp tests/data/5gen.bp \
--sample Sample_1 \
--out test_karyogram.png \
--centromeres tests/data/centromeres_hg19.txt \
--title "5 Generation Karyogram" \
--colors 'CEU:blue,YRI:red'
This will output a file test_karyogram.png. The example is shown below.
All files used in this example are described here.
Detailed Usage
haptools
haptools: A toolkit for simulating and analyzing genotypes and phenotypes while taking into account haplotype information
haptools [OPTIONS] COMMAND [ARGS]...
Options
- --version
Show the version and exit.
karyogram
Visualize a karyogram of local ancestry tracks
haptools karyogram [OPTIONS]
Options
- --bp <bp>
Required Path to .bp file with breakpoints
- --sample <sample>
Required Sample ID to plot
- --out <out>
Required Name of output file
- --title <title>
Optional plot title
- --centromeres <centromeres>
Optional file with telomere/centromere cM positions
- --colors <colors>
Optional color dictionary. Input can be from the matplotlib list of colors or in hexcode. Format is e.g. ‘YRI:blue,CEU:green’
- -v, --verbosity <verbosity>
The level of verbosity desired
- Default:
INFO- Options:
CRITICAL | ERROR | WARNING | INFO | DEBUG | NOTSET